Objective 6
Define what a
positive, negative, and zero correlation is.
Explanation:
My textbook, Psychology Tenth Edition in Modules, says correlation is a measure of the extent to which two factors vary together, and thus of how well either factor predicts the other. In my own words correlation is the relationship between two variables, and it shows how well the variables go together. We measure correlation with a correlation coefficient. A correlation coefficient is a number from -1 to 1. The closer the absolute value of the correlation coefficient is to 1, the stronger the relationship. Just because two variables have a negative correlation doesn’t mean they have a weaker relationship. Negative correlation is when two variables are going the opposite way. One variable would be going up, and the other one would be going down. Positive correlation is the when two variables are going the same direction like both going up or both doing down. Lastly, zero correlation is when two variables have nothing to do with each other. Scatterplots can be really revealing, so they show correlation really well. When the dots don't have much scatter the correlation is high. When two variables have a positive correlation the dots have a positive slope. When there is a negative correlation the dots have a negative slope, and when there is a correlation of zero the dots are scattered.
My textbook, Psychology Tenth Edition in Modules, says correlation is a measure of the extent to which two factors vary together, and thus of how well either factor predicts the other. In my own words correlation is the relationship between two variables, and it shows how well the variables go together. We measure correlation with a correlation coefficient. A correlation coefficient is a number from -1 to 1. The closer the absolute value of the correlation coefficient is to 1, the stronger the relationship. Just because two variables have a negative correlation doesn’t mean they have a weaker relationship. Negative correlation is when two variables are going the opposite way. One variable would be going up, and the other one would be going down. Positive correlation is the when two variables are going the same direction like both going up or both doing down. Lastly, zero correlation is when two variables have nothing to do with each other. Scatterplots can be really revealing, so they show correlation really well. When the dots don't have much scatter the correlation is high. When two variables have a positive correlation the dots have a positive slope. When there is a negative correlation the dots have a negative slope, and when there is a correlation of zero the dots are scattered.
Example:
This picture is a good example of correlation. It shows how if the absolute value of the correlation coefficient is closer to 1 the relationship is stronger. This is usually where people get confused. A correlation of .89 and -.89 have the same strength, but one is a negative and one is positive.
This picture is a good example of correlation. It shows how if the absolute value of the correlation coefficient is closer to 1 the relationship is stronger. This is usually where people get confused. A correlation of .89 and -.89 have the same strength, but one is a negative and one is positive.
http://pradeepshettys.files.wordpress.com/2011/09/correlation_coefficient.gif
Example:
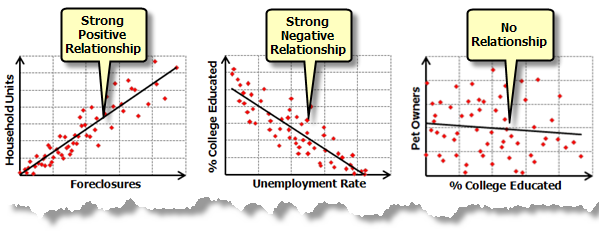
This picture shows positive, negative, and zero correlation. There is a positive correlation between household units and foreclosures. As the household units went up so did the foreclosures, and when the household units went down so did the foreclosures. Both variables went the same way. There is a negative correlation between % college educated and the unemployment rate. If the % college educated went up the unemployment rate went down, and if the unemployment rate went up, the % college educated went down. One variable went up while the other went down. Lastly there is zero correlation between pet owners and % college educated. There is no relationship between the two variables.
This picture shows positive, negative, and zero correlation. There is a positive correlation between household units and foreclosures. As the household units went up so did the foreclosures, and when the household units went down so did the foreclosures. Both variables went the same way. There is a negative correlation between % college educated and the unemployment rate. If the % college educated went up the unemployment rate went down, and if the unemployment rate went up, the % college educated went down. One variable went up while the other went down. Lastly there is zero correlation between pet owners and % college educated. There is no relationship between the two variables.
http://resources.esri.com/help/9.3/arcgisdesktop/com/gp_toolref/spatial_statistics_toolbox/scatterplots.png
